Community Description
Introduction
Known officially as the District of Columbia, and commonly known as Washington or DC, the District is now home to more than 700,000 residents. The District is the 61 square miles of urban land and seven square miles of water in the center of the Washington Statistical Area bordered by Northern Virginia, Montgomery and Prince George’s Counties in Maryland, and the Potomac River. The Anacostia River runs through the southeast area of the District and Rock Creek Park dominates the natural landscape of the northwest area.
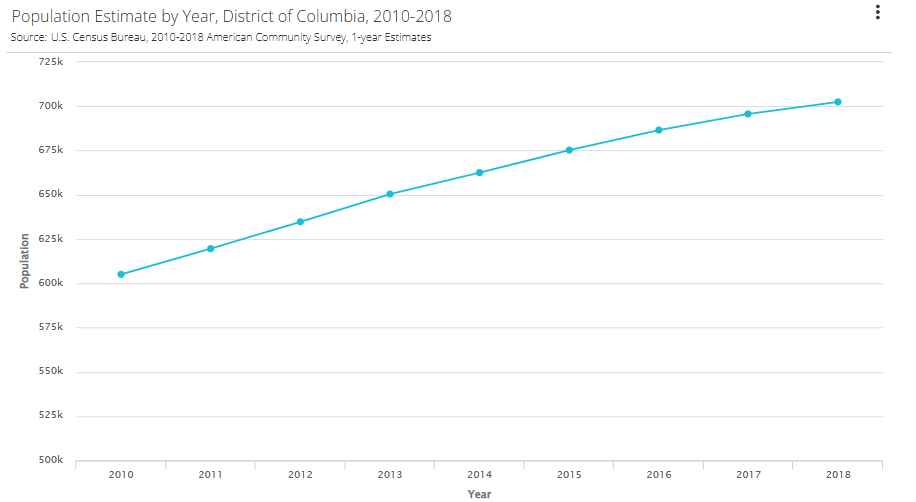
While many major cities in the United States have experienced population decline in recent years, the District of Columbia has seen a population increase of 16% in the last decade. [1]
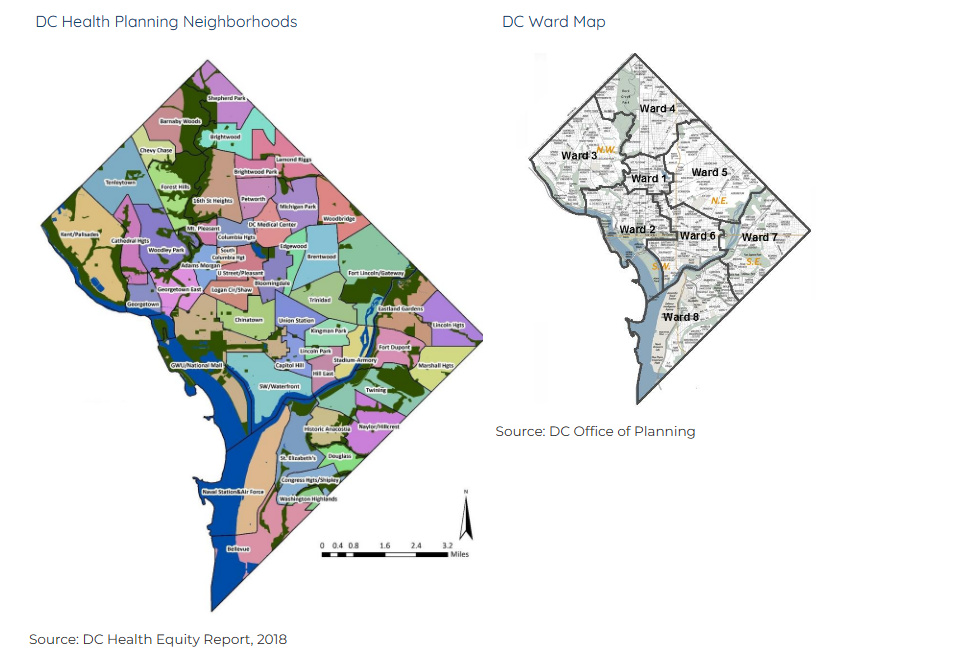
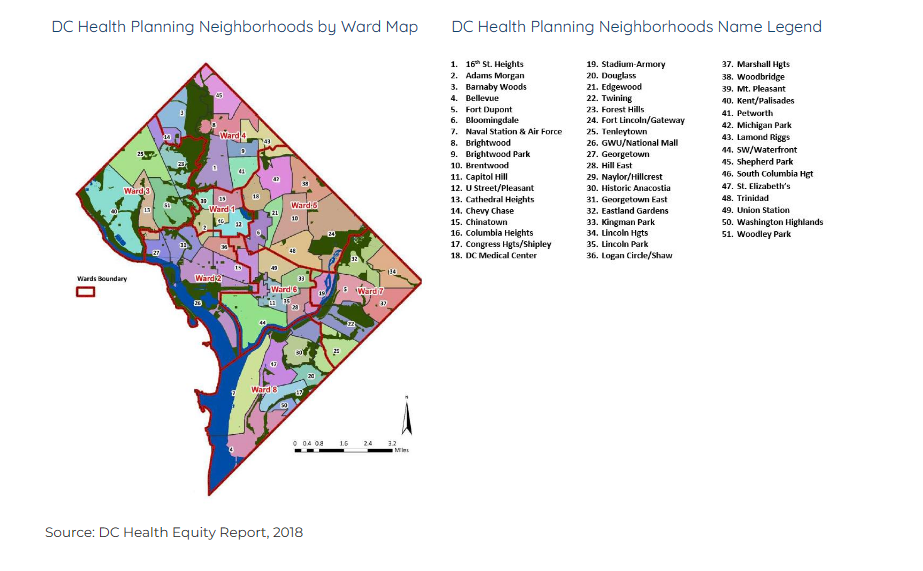
DC is divided into eight political wards created for the purpose of voting and representation. DC can also be described as a city of neighborhoods, each with their unique history, culture, architecture and demographics. The eight wards are composed of 51 statistical neighborhood groupings called “Health Planning Neighborhoods,” used by DC Health and partners for planning, data analysis, and program/policy decision-making.
Demographics
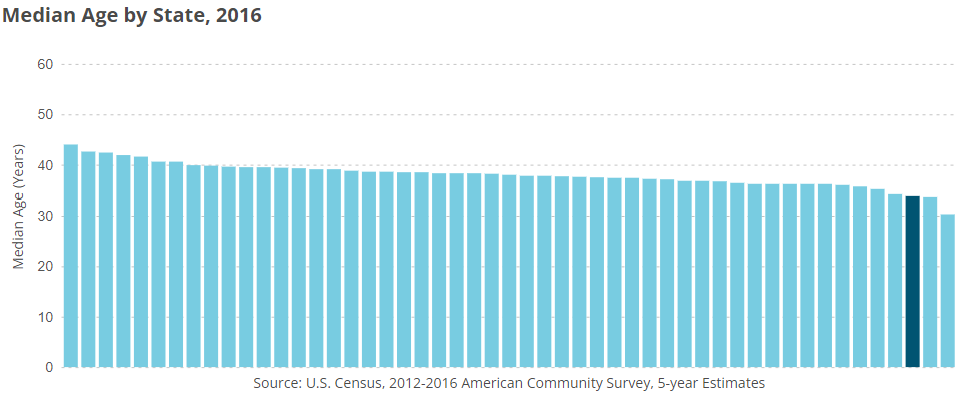
The District is a demographically diverse and culturally rich city. The median age in DC is 34 years old, making the District the third youngest in the United States. Among the eight wards in the District, the population in Ward 4 is the oldest with a median age of 39.9, while Ward 8 is the youngest with a median age of 29.8. [1]
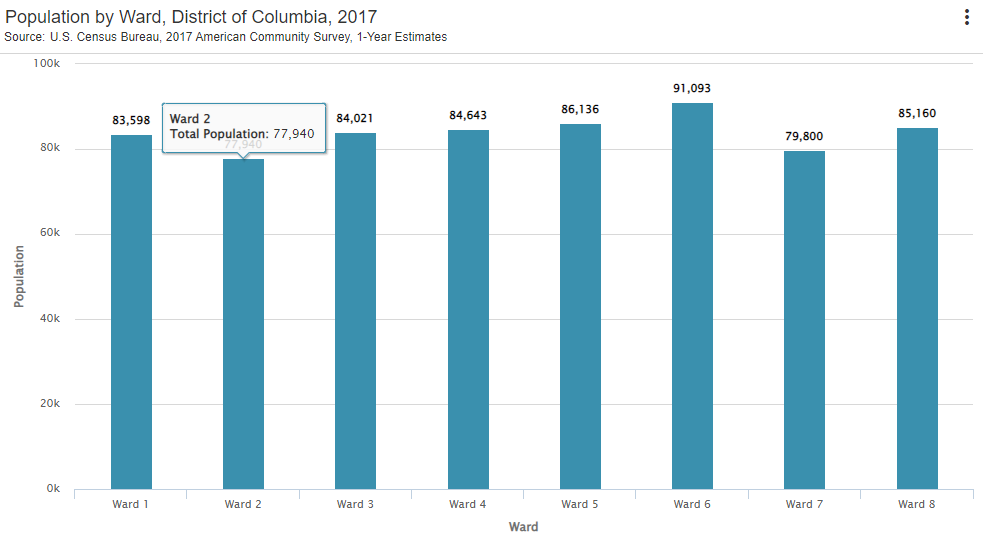
As of 2017, Ward 6 was the most populated ward in the District with 91,093 residents who call it home, while the least populated was Ward 2 with 77,940 residents. [1]

Population Distribution & Trends
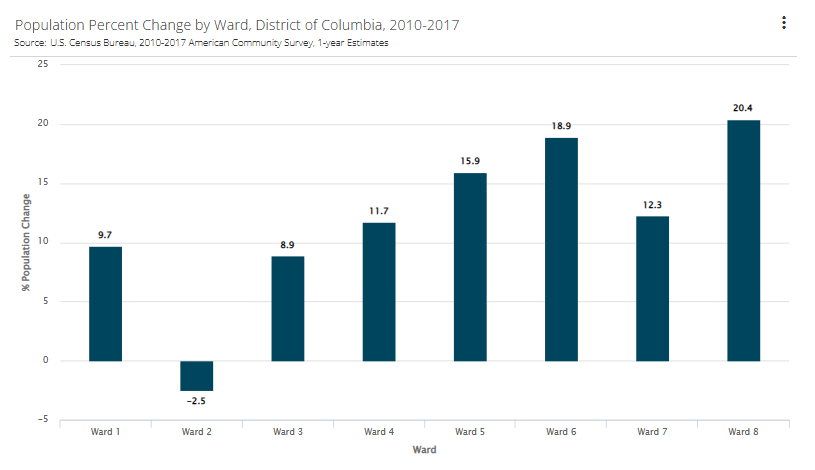
In 2010, Ward 2 had the largest number of residents, and Ward 8 had the smallest. Between 2010 and 2017, Ward 8 experienced the largest population growth with a 20.4% increase in population and Ward 2 saw a 2.5% decrease in population, the only ward to do so, during the same time. As of 2017, the most populous demographic group in the District by age and sex are women ages 25-29. [1]
DC Geographic Mobility, 2017
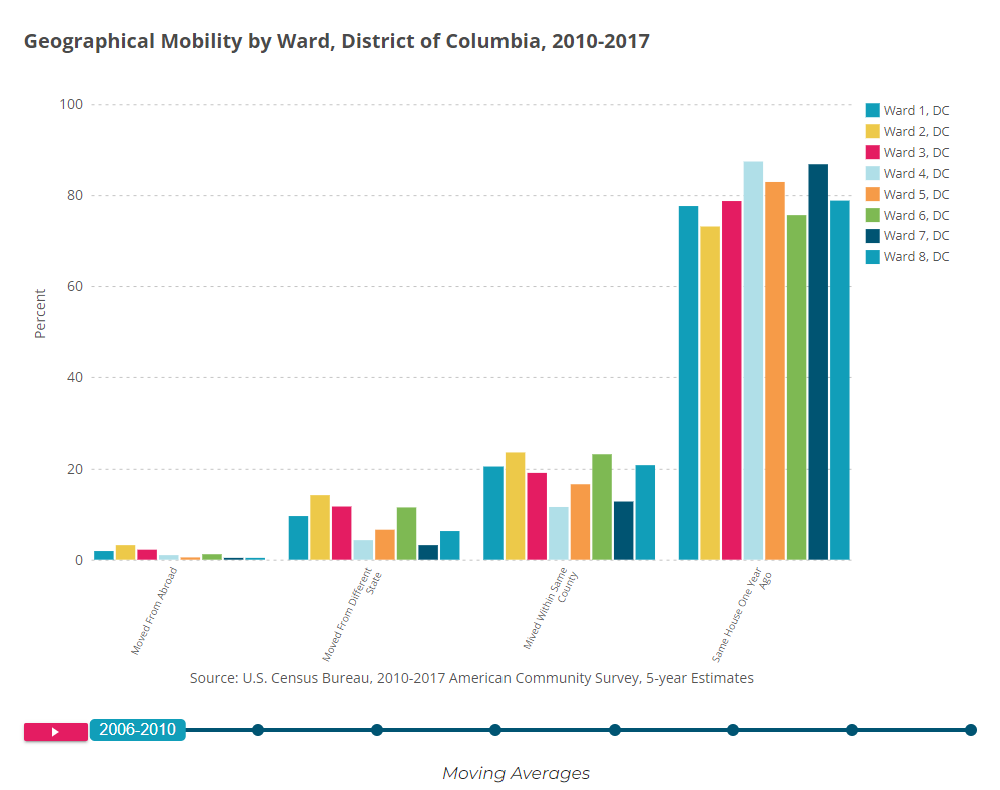
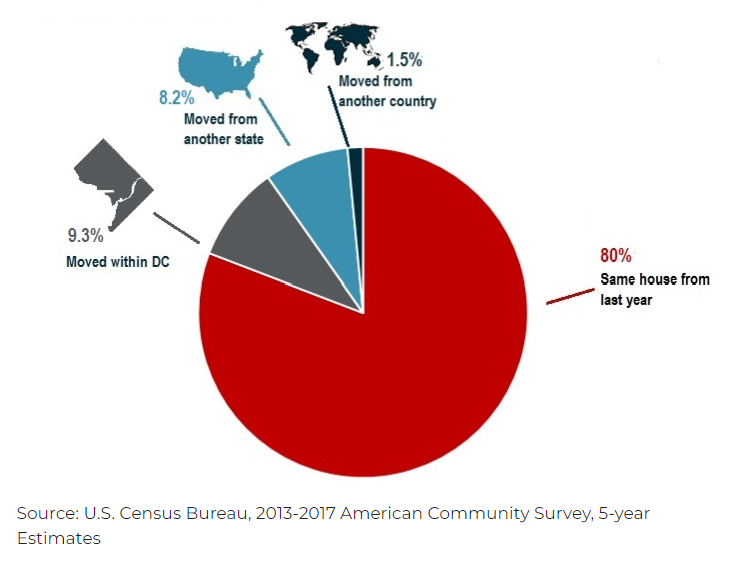 District wide, 80% of residents in 2017 lived in the same home they lived in the previous year. Ward 4 experienced the most geographic stability as nearly 90% of residents in the ward lived in the same house the year prior. Ward 2 had the highest percentage of residents who moved to DC from a different country, a different state, and a different residence within DC. [1]
Racial and Ethnic Diversity
In highly diverse populations like the District of Columbia, changing demographic characteristics have important implications for the health of residents. Throughout this report you will see comparisons based on several demographic identifiers, including race and ethnicity. The importance of including these comparisons are to demonstrate how health disparities are essential considerations when promoting health, implementing equitable policies and programs, and distributing health care services. Racism rather than “race” better explains racial disparities, and it is important to move beyond solely documenting disparities to address the root causes.
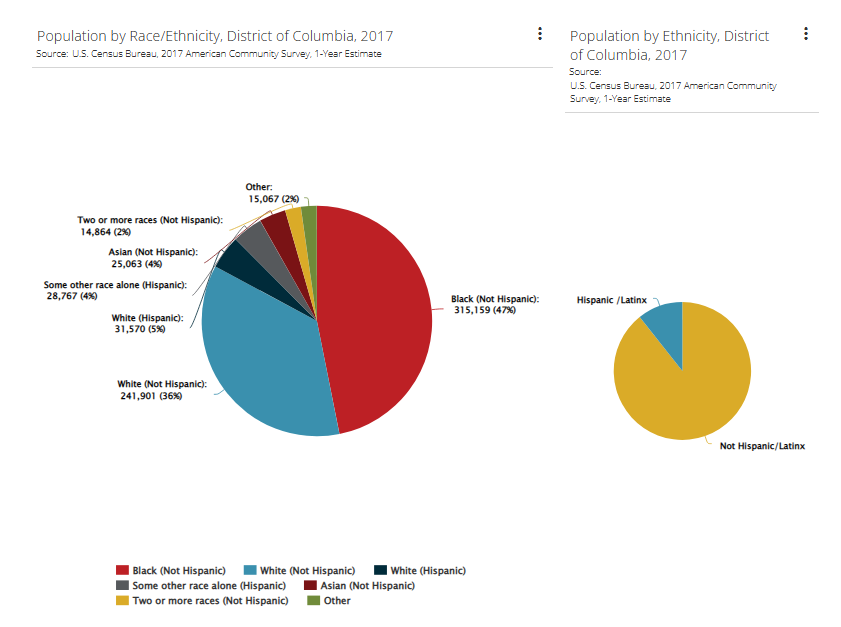
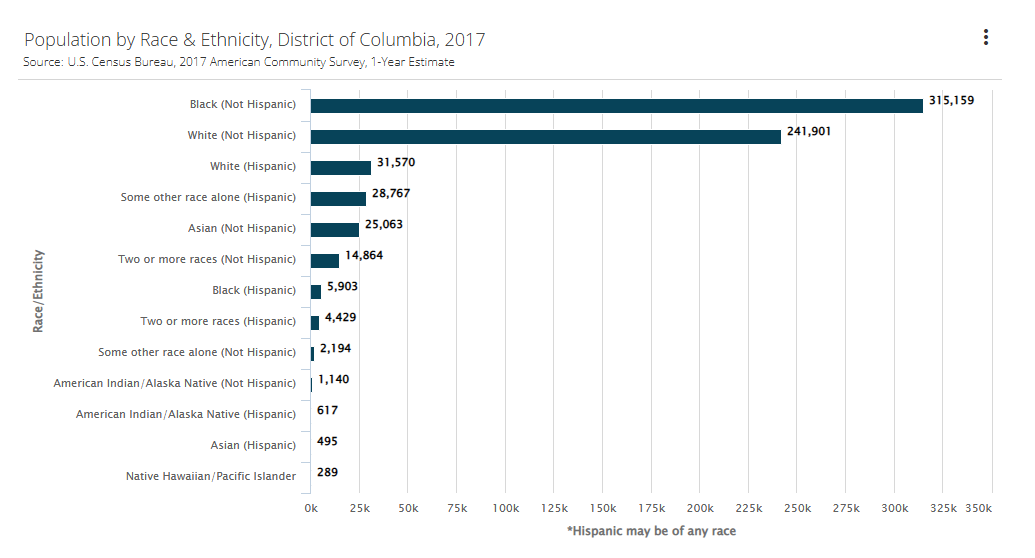
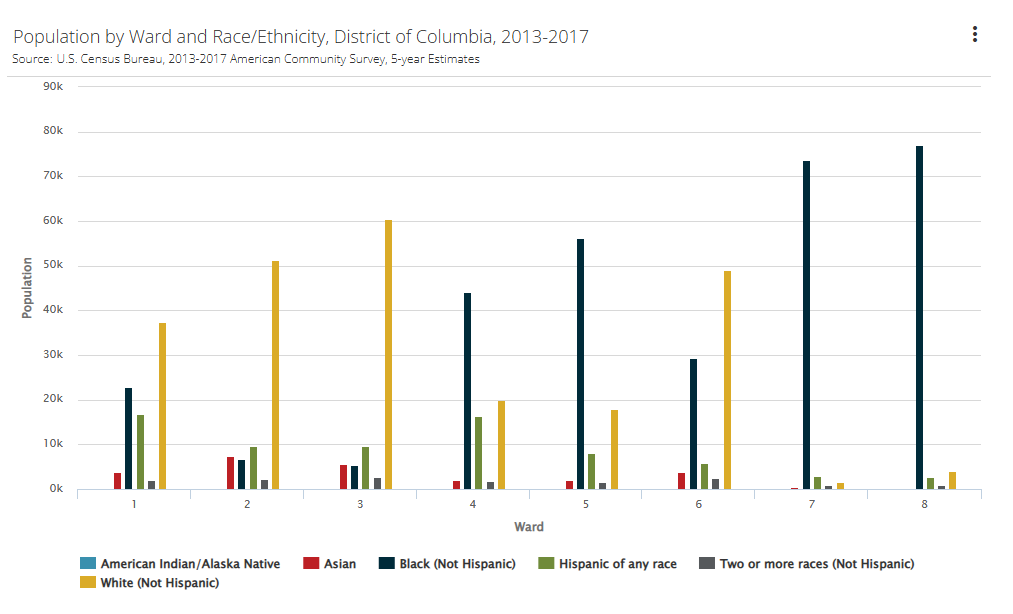
In 2017 the US Census Bureau’s American Community Survey estimated that Non-Hispanic Blacks or African Americans are the largest racial/ethnic group in DC at 47% of the population and represent the majority in four of the District’s eight wards (Ward 4, Ward 5, Ward 7, and Ward 8). Non-Hispanic Whites are the second largest racial/ethnic group in the District at 36% and also represent the majority in four of the District’s eight wards (Ward 1, Ward 2, Ward 3 and Ward 6). Hispanic/Latinxs may be of any race, and as an ethnic group accounted for 11% of the population in DC, with the majority living in Wards 1 and 4. [1]
As in many US urban cities, racial segregation is marked. Wards 2 and 3 in the northwest quadrant have large majority White populations while Wards 7 and 8 have large majority Black or African American populations. [1]
Racism is a system of structuring opportunity and assigning value based on the social interpretation of how one looks (which is what we call “race”), that unfairly disadvantages some individuals and communities, unfairly advantages other individuals and communities, and saps the strength of the whole society through the waste of human resources.
— American Public Health Association Past President
Camara Jones, MD, PhD, MPH
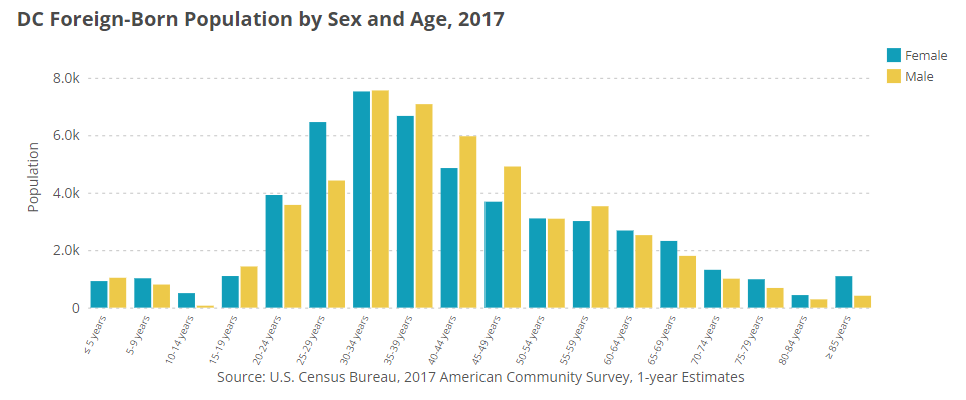
The total immigrant population in the District has grown steadily from 33,600 to 94,420 between 1970 and 2017.[2] In 1970, immigrants represented 4% of the DC resident population, and in 2017, immigrants grew to represent approximately 14% of the resident population. [1, 2] According to an Urban Institute Report commissioned and funded by the DC Mayor’s Office of Community Affairs, three out of every four foreign-born residents living in DC are collectively represented by four immigrant groups, Latinx, Asian and Pacific Islander (API), African, and Caribbean.[2]


Lesbian, Gay, Bisexual, Transgender and Questioning (LGBTQ) Diversity
As of 2013, 10.7% of DC adults identify as either lesbian, gay, bisexual, and/or transgender. [3] The LGBT community includes people of all races, ethnicities, religions, and socioeconomic groups. According to the Williams Institute, in 2017, DC had the highest percentage of LGBT residents compared to all other states. Among middle school youth, 6.2% identify as lesbian, gay or bisexual, and 12.3% of high school youth identify as the same.[4] Research suggests that LGBTQ individuals face health disparities linked to social stigma, discrimination, and denial of their civil and human rights. Better understanding and eliminating LGBT health disparities and enhancing efforts to improve LGBT health are necessary to ensure that LGBTQ individuals can lead long, healthy lives.
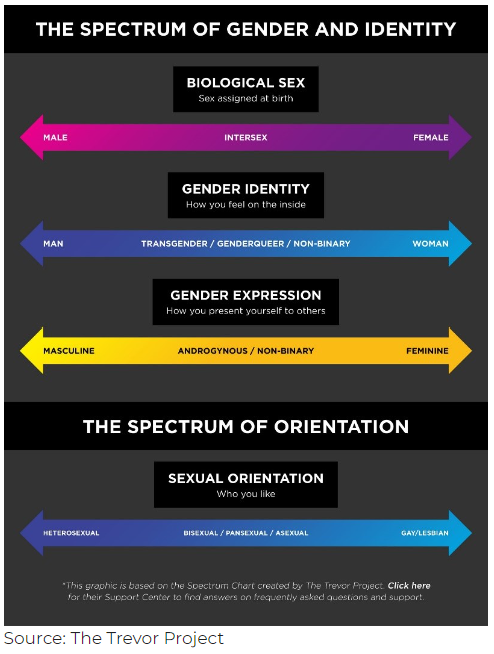
The DC Healthy People 2020 goal is for the LGBTQ, asexual and intersex communities in DC to experience social inclusion, respect, and equal access to all community benefits and services. Diversity in our community, including differences in biological sex, gender identity, sexual orientation, relationships, gender presentation, and gender expression make up who individuals are (3). The infographic below illustrates the spectrum of identity, orientation, and gender expression
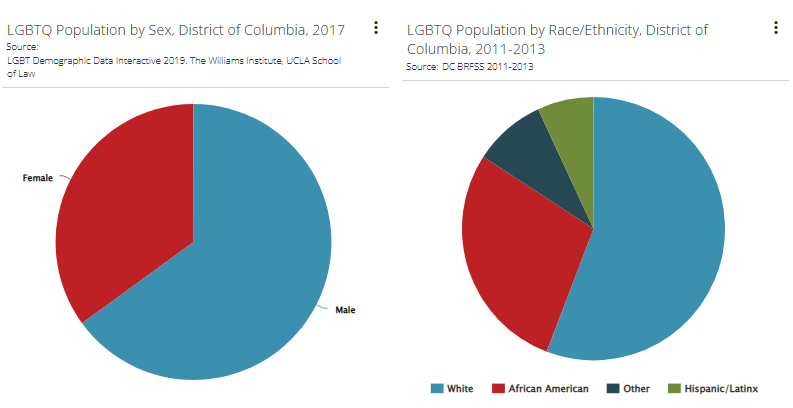
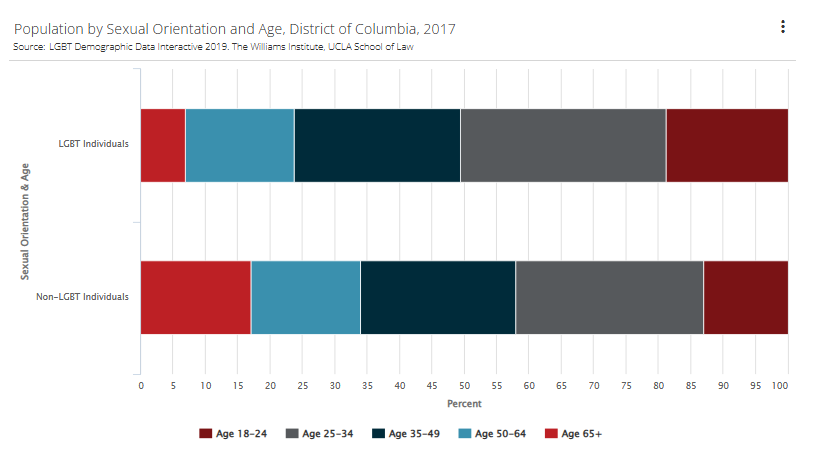
Data around LBGTQ populations are improving, but there are still gaps around aging LGBTQ populations and policy barriers they face in achieving their highest potential for health. Only recently was federal law passed that allowed same-sex couples to marry, which has many implications in family life, mental health, and tax and other monetary benefits provided by government-recognized marriage. Other policy areas where we have seen advancement in the District is the ability for transgender populations to change gender markers on birth and death certificates [6], and select a non-binary gender marker on driver’s licenses [7], which can facilitate a person aligning their identity with their important government documents, and improve access to essential services and benefits.
Families
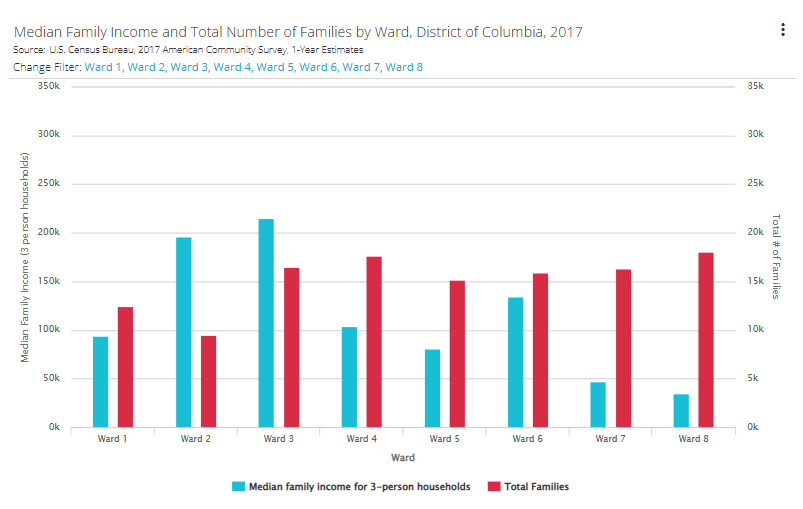
The U.S. Census Bureau defines a family as, “any two or more people residing together, and related by birth, marriage, or adoption.” In 2017, the average family size in DC was 3.25 people, and the median income for a family of this approximate size was $86,689. [1]
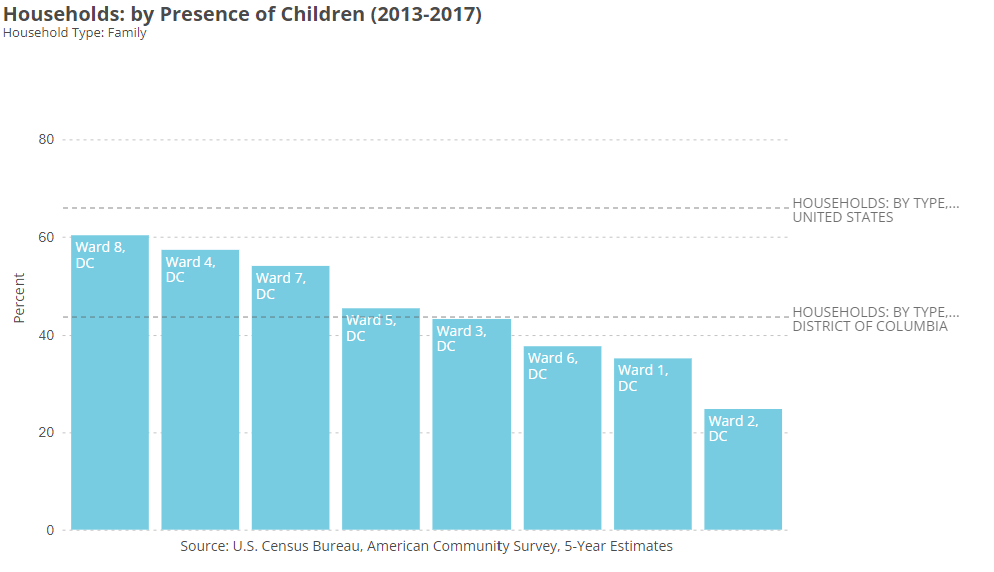
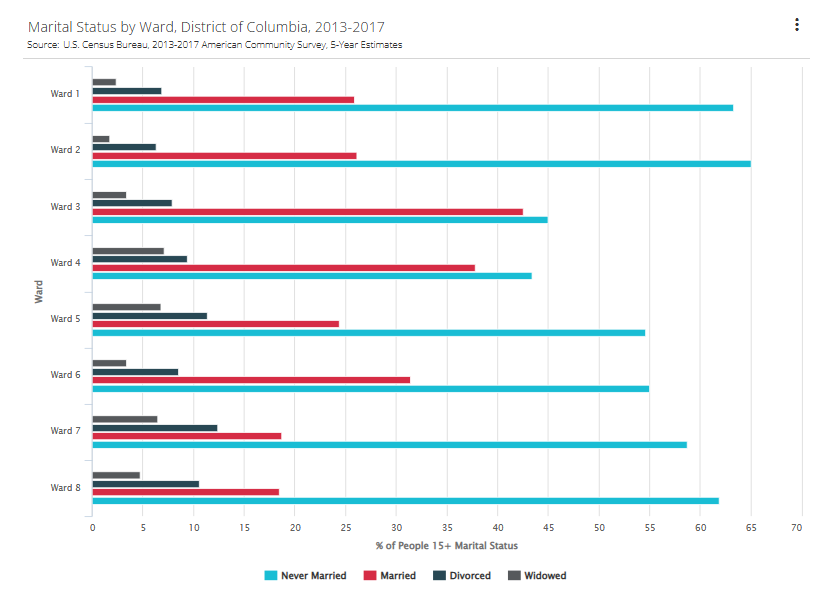
As illustrated in the graphs in this section, these outcomes are vastly different at the ward level. Ward 8 represents the largest number of family households, both with and without children, while concurrently having the lowest median income for a family. District wide 43.7% of households have at least one child under the age of 18 living in the home, compared to the U.S. average of 65.9%. Among LGBT individuals and couples in the District, 10% of these families are raising children, which is the lowest percentage of LGBT people raising children among all 50 states. [4]
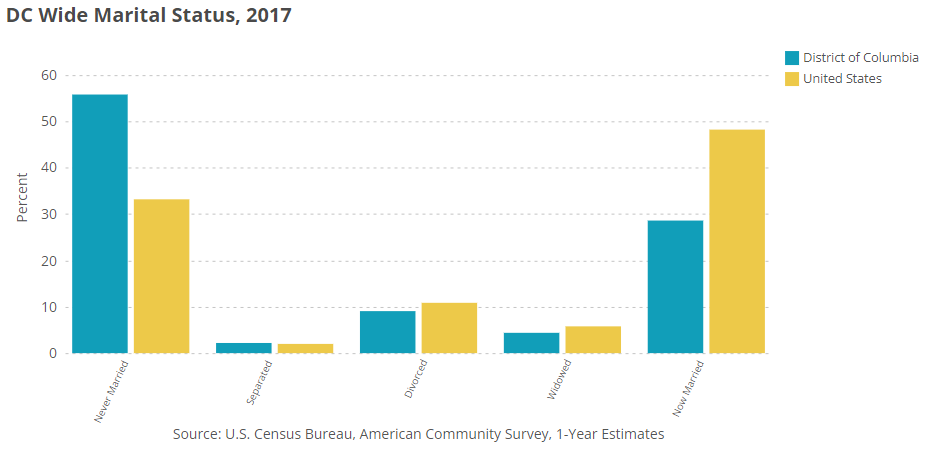
Among all DC residents of legal age, nearly 56% have never been married compared to 33% in the U.S., and 28.5% of DC residents are currently married compared to 48.2% of all U.S. residents. [1]
Disability Status
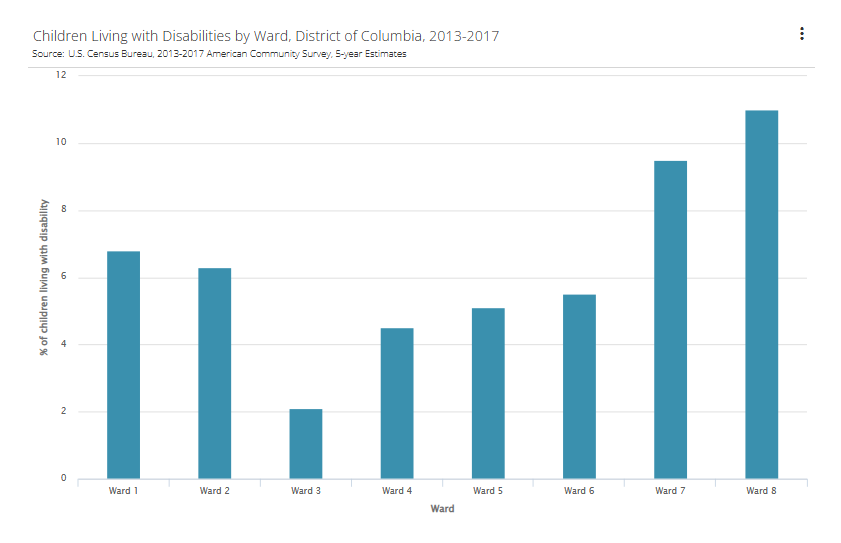
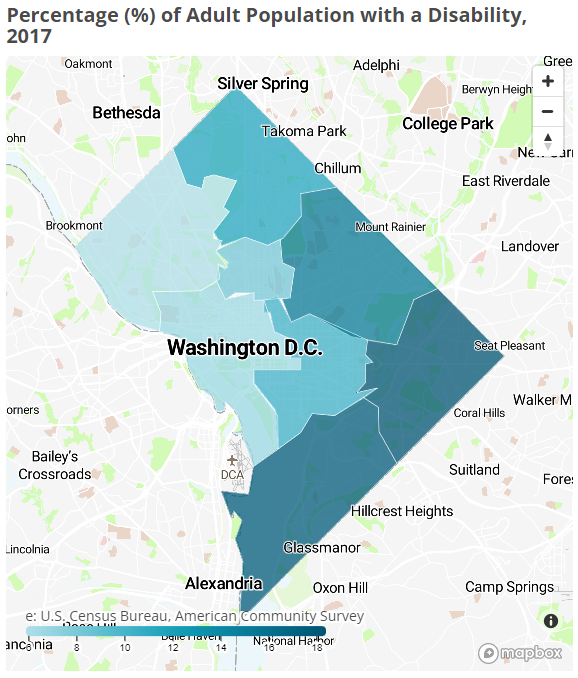 In 2016, 16.4% of adults in the District reported living with a disability. [1] The World Health Organization defines disabilities in three categories:
1. Impairment in a person’s body or mental functioning (i.e., loss of a limb, loss of vision, memory loss).
2. Activity limitation (i.e., difficulty seeing, hearing, walking or problem solving).
3. Participation restrictions (i.e., working, engaging in social activities, or obtaining health care).
Disability is not just a health problem, but rather a complex interaction between a person’s body and the society in which they live. The DC Healthy People 2020 goal for DC residents living with disabilities is for these adults and youth to be socially included, successful, and respected at work, school, and university.
Throughout this report you will see comparisons based on demographic identifiers, including, where available, disability status. The importance of including these comparisons are to demonstrate how health disparities are essential considerations when promoting health, implementing equitable policies and programs, and distributing health care services.
Civic Engagement
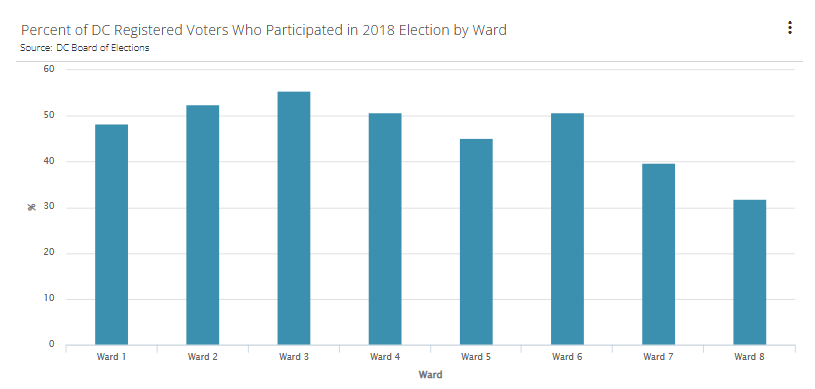
As of the 2018 general election there were 500,511 registered voters in the District. Citywide, 46.27% of residents registered to vote participated in this most recent election. [5]
In the District, you have the right to register to vote if you:
• Are a US citizen;
• Maintain residency in the District for at least 30 days prior to the election in which you intend to vote;
• Are at least 17 years old and 18 years old by the next general election;
• Have not been found legally incompetent to vote; and
• Are not currently incarcerated for a felony conviction.
Citizens who are currently incarcerated for misdemeanors, in jail awaiting trial for a felony offense, and returning citizens are eligible to register to vote and participate in elections.
The District is divided into 41 districts called Advisory Neighborhood Commissions, or ANCs. ANCs are non-partisan, neighborhood bodies made up of 2-12 commissioners who make decisions about a broad range of issues in your community. They are a unique feature of the District’s Home Rule Charter. The Commissioners, who serve two-year terms without pay, are elected at DC Elections in November in even-numbered years (e.g. 2018). The ANCs were established to bring government closer to the people, and to bring the people closer to government [8].
In addition to providing people with a greater say in the matters that affect their neighborhoods, ANCs were intended to end the duplication of effort caused by the proliferation of special advisory groups. The ANCs’ main job is to be their neighborhood’s official voice in advising the District government (and Federal agencies) on things that affect their neighborhoods. To find your ANC and learn more about opportunities to engage with your commissioners, enter your address in the search engine below.
Data Resources
1. United States Census Bureau
2. Urban Institute Report on State of Immigrants in the District of Columbia
3. DC Health Report on the Health of the Lesbian, Gay, Bisexual, and Transgender Community
4. Williams Institute LGBT Data & Demographics
5. DC Board of Elections Certified Results & Voting Statistics
7. Council of the District of Columbia, Nonbinary Identification Cards Amendment Act of 2017
8. Advisory Neighborhood Commissions


